
I was motivated to write this since my area, southwest Pennsylvania, is experiencing very low humidity levels. I was astounded to see the humidity on my Home Weather Station as low is 11%. Checking the local weather, it was similar, so I knew it wasn’t an error with my equipment.
In the Pittsburgh Area, 40% Humidity and higher is common. In the summer the humidity ranges up to 100%, but is often above 75%. So, 11% is very low by comparison. And when you’re accustomed to higher Humidity, (one page said the Average Annual State Humidity measured at Harrisburg is 77% at night and 54% in the day time) these Low Humidity Days are not pleasant, they make it feel cooler than it should feel, and more:
The Effects of Low Humidity on Your Health and Comfort
(On the above page, an interesting read, ignore one thing they say about adding humidity to your home, namely DO NOT Boil water on your stove for the purpose of Increasing Humidity, invariably someone will fall asleep or go out without turning off the water, the water will boil out, the pot will overheat, and a fire may, eventually, result).
Links on Humidity:
Current Relative Humidity Map for the United States (Note, this page DID NOT DISPLAY CORRECTLY initially today, but after about 10 minutes, I tried again and it was fine).
Current Relative Humidity for Pennsylvania
Of Humidity:
“Is there some special property of warm air that lets it soak up more water vapor? Not really. It’s just that, at higher temperatures, water molecules are more likely to go into the vapor phase, so there will be more water vapor in the air.”
From the National Weather Service:
WATER VAPOR:
Water is a unique substance. It can exist as a liquid, solid (ice), and gas (water vapor). A primary way water vapor increases in the atmosphere is through evaporation. Liquid water evaporates from oceans, lakes, rivers, plants, the ground, and fallen rain. A lot or a little water vapor can be present in the air. Winds in the atmosphere then transport the water vapor from one place to another. A major source of water vapor in Kentucky is the Gulf of Mexico. Most of the water vapor in the atmosphere is contained within the first 10,000 feet or so above the earth’s surface. Water vapor also is called moisture.
ABSOLUTE HUMIDITY:
Absolute humidity (expressed as grams of water vapor per cubic meter volume of air) is a measure of the actual amount of water vapor (moisture) in the air, regardless of the air’s temperature. The higher the amount of water vapor, the higher the absolute humidity. For example, a maximum of about 30 grams of water vapor can exist in a cubic meter volume of air with a temperature in the middle 80s. SPECIFIC HUMIDITY refers to the weight (amount) of water vapor contained in a unit weight (amount) of air (expressed as grams of water vapor per kilogram of air). Absolute and specific humidity are quite similar in concept.
RELATIVE HUMIDITY:
Relative humidity (RH) (expressed as a percent) also measures water vapor, but RELATIVE to the temperature of the air. In other words, it is a measure of the actual amount of water vapor in the air compared to the total amount of vapor that can exist in the air at its current temperature. Warm air can possess more water vapor (moisture) than cold air, so with the same amount of absolute/specific humidity, air will have a HIGHER relative humidity if the air is cooler, and a LOWER relative humidity if the air is warmer. What we “feel” outside is the actual amount of moisture (absolute humidity) in the air.
My Comment: Relative Humidity is the amount of moisture possible for a specific volume of air to hold at a given temperature. At lower or higher temperatures, it’s possible to have 100% Relative Humidity, but it’s always keyed to that Temperature. Raise the Temperature of a Volume of Air, and the Relative Humidity Drops. This happens in homes, in the Winter, as the Furnace Heats the Air in the Home, the Relative Humidity Drops in the Home.
DEWPOINT:
Meteorologists routinely consider the “dewpoint” temperature (instead of, but analogous to absolute humidity) to evaluate moisture, especially in the spring and summer. The dewpoint temperature, which provides a measure of the actual amount of water vapor in the air, is the temperature to which the air must be cooled in order for that air to be saturated. Although weather conditions affect people differently, in general in the spring and summer, surface dewpoint temperatures in the 50s usually are comfortable to most people, in the 60s are somewhat uncomfortable (humid), and in the 70s are quite uncomfortable (very humid). In the Ohio Valley (including Kentucky), common dewpoints during the summer range from the middle 60s to middle 70s. Dewpoints as high as 80 or the lower 80s have been recorded, which is very oppressive but fortunately relatively rare. While dewpoint gives one a quick idea of moisture content in the air, relative humidity does not since the humidity is relative to the air temperature. In other words, relative humidity cannot be determined from knowing the dewpoint alone, the actual air temperature must also be known. If the air is totally saturated at a particular level (e.g., the surface), then the dewpoint temperature is the same as the actual air temperature, and the relative humidity is 100 percent.
HEAT INDEX:
While dewpoint is a more definitive measure of moisture content, it is the relative humidity that commonly is used to determine how hot and humid it “feels” to us in the spring and summer based on the combined effect of air temperature and humidity. This combined effect is called the ” Heat Index.” The higher the air temperature and/or the higher the relative humidity, the higher is the heat index and the hotter it feels to our bodies outside.
Useful Questions supplied by the National Weather Service:
QUESTION 1:
In the winter, if the air temperature was 40˚ F and the dewpoint was also 40˚, what would the relative humidity be? Now, in the spring, if the air temperature was 70˚ and the dewpoint was 70˚, what would the relative humidity be? In which situation would if feel more humid? What does this tell you about relative humidity?
ANSWER 1:
“If the air temperature and dewpoint temperature were both 40˚, the relative humidity would be 100%. Likewise, if the air and dewpoint temperature were both 70˚, the relative humidity would again be 100%. Despite the relative humidity being the same in both cases, it certainly would feel more humid if the air and dewpoint temperatures were both 70˚. This shows how the relative humidity tells you little about the actual moisture content of the air (much more moisture is contained in the air for the summer case), and how the same relative humidity value can occur in completely different situations having very different “feels” to our bodies.”
QUESTION 2:
If the air temperature was 95˚ F with a dewpoint of 70˚, would the air’s relative humidity be higher or lower than if the air temperature was 70˚ with a dewpoint of 55˚? Which air mass would feel more uncomfortable to you?
ANSWER 2:
“If the air temperature was 95˚ and the dewpoint temperature was 70˚, the relative humidity of this air mass would be 45%. The relative humidity in this case seems rather low, doesn’t it, despite a hot air temperature and high dewpoint? Conversely, for the air mass with a temperature of 70˚ and a dewpoint of 55˚ the relative humidity would be about 60%.
In other words, the relative humidity for this cooler air mass containing less moisture would actually be HIGHER than that for the hotter, more humid air mass. This shows how relative humidity can be very misleading and that one cannot consider relative humidity alone to determine how humid it feels outside.
In this example, obviously the air mass with a relative humidity of 45% [at 95˚] would feel more uncomfortable than the air with a relative humidity of 60% [at 70˚].”
QUESTION 3:
If the air temperature was 90˚ F with a relative humidity of 60% in the afternoon, would it feel more uncomfortable to a person than if it was 75˚ outside with a relative humidity of 100% in the morning?
ANSWER 3:
“At 90˚ with a relative humidity of 60%, it would “feel” like 100˚ outside; at 75˚with a relative humidity of 100%, it would only “feel” like 80˚. Despite the much different relative humidity value, the absolute humidity or dewpoint would be about the SAME in both these cases (i.e., dewpoint of 75˚). This “feeling” that combines air temperature and moisture in the air is referred to as the “heat index.””
This is the Older Version of the Instrument and Field Unit that I have, good review on it:
Ambient Weather WS-2902 Osprey Weather Station review: The best choice for smart-home buffs
The Manufacturer’s website for my Weather Station:
Ambient Weather WS-2902C Smart Weather Station with WiFi Remote Monitoring and Alerts & Thermo Hygrometer (Mine does not have the extra Temp/Humidity Indoor Sensor Shown)
Amazon Link: Ambient Weather WS-2902C WiFi Smart Weather Station
For the Above Weather Station there is an Indoor Display Unit that is not connected to the Internet and is less expensive. I have 2 displays, one in the Living Room with Wireless Internet, one in the Bedroom without Wireless Internet (not even an option on that model display), and if you’re not going to check your weather station via an App on your Smart Phone, the Internet Version may not be the best choice anyway, as the Internet Icon Flashes until you connect it, and I had no intent on connecting, but did to get away from the flashing Internet Icon.
You should be able to buy the following Console (No Internet) and the Outdoor Sensor Array and pair them up, about $30 less than the Wireless Version/Outdoor Sensor Array with Internet sold together.
Ambient Weather WS-1900-CONSOLE Console Only, WS-1900 Wireless Weather Station

The Newer Style Display with 2.4 GHz Wireless Internet Connection is above, and the Older Style Display without Wireless Internet Connection is below. They both work fine with the Wireless Outdoor Sensor Unit (using 915 MHz , the Outdoor Unit Sends Sensor Info to the Indoor Display, the Wireless Connection on 915 MHz is not involved with the Wireless Internet Connection on 2.4 GHz), both my units work simultaneously with the Sensor Unit, I don’t think they Poll it for Data, it Broadcasts and they receive.
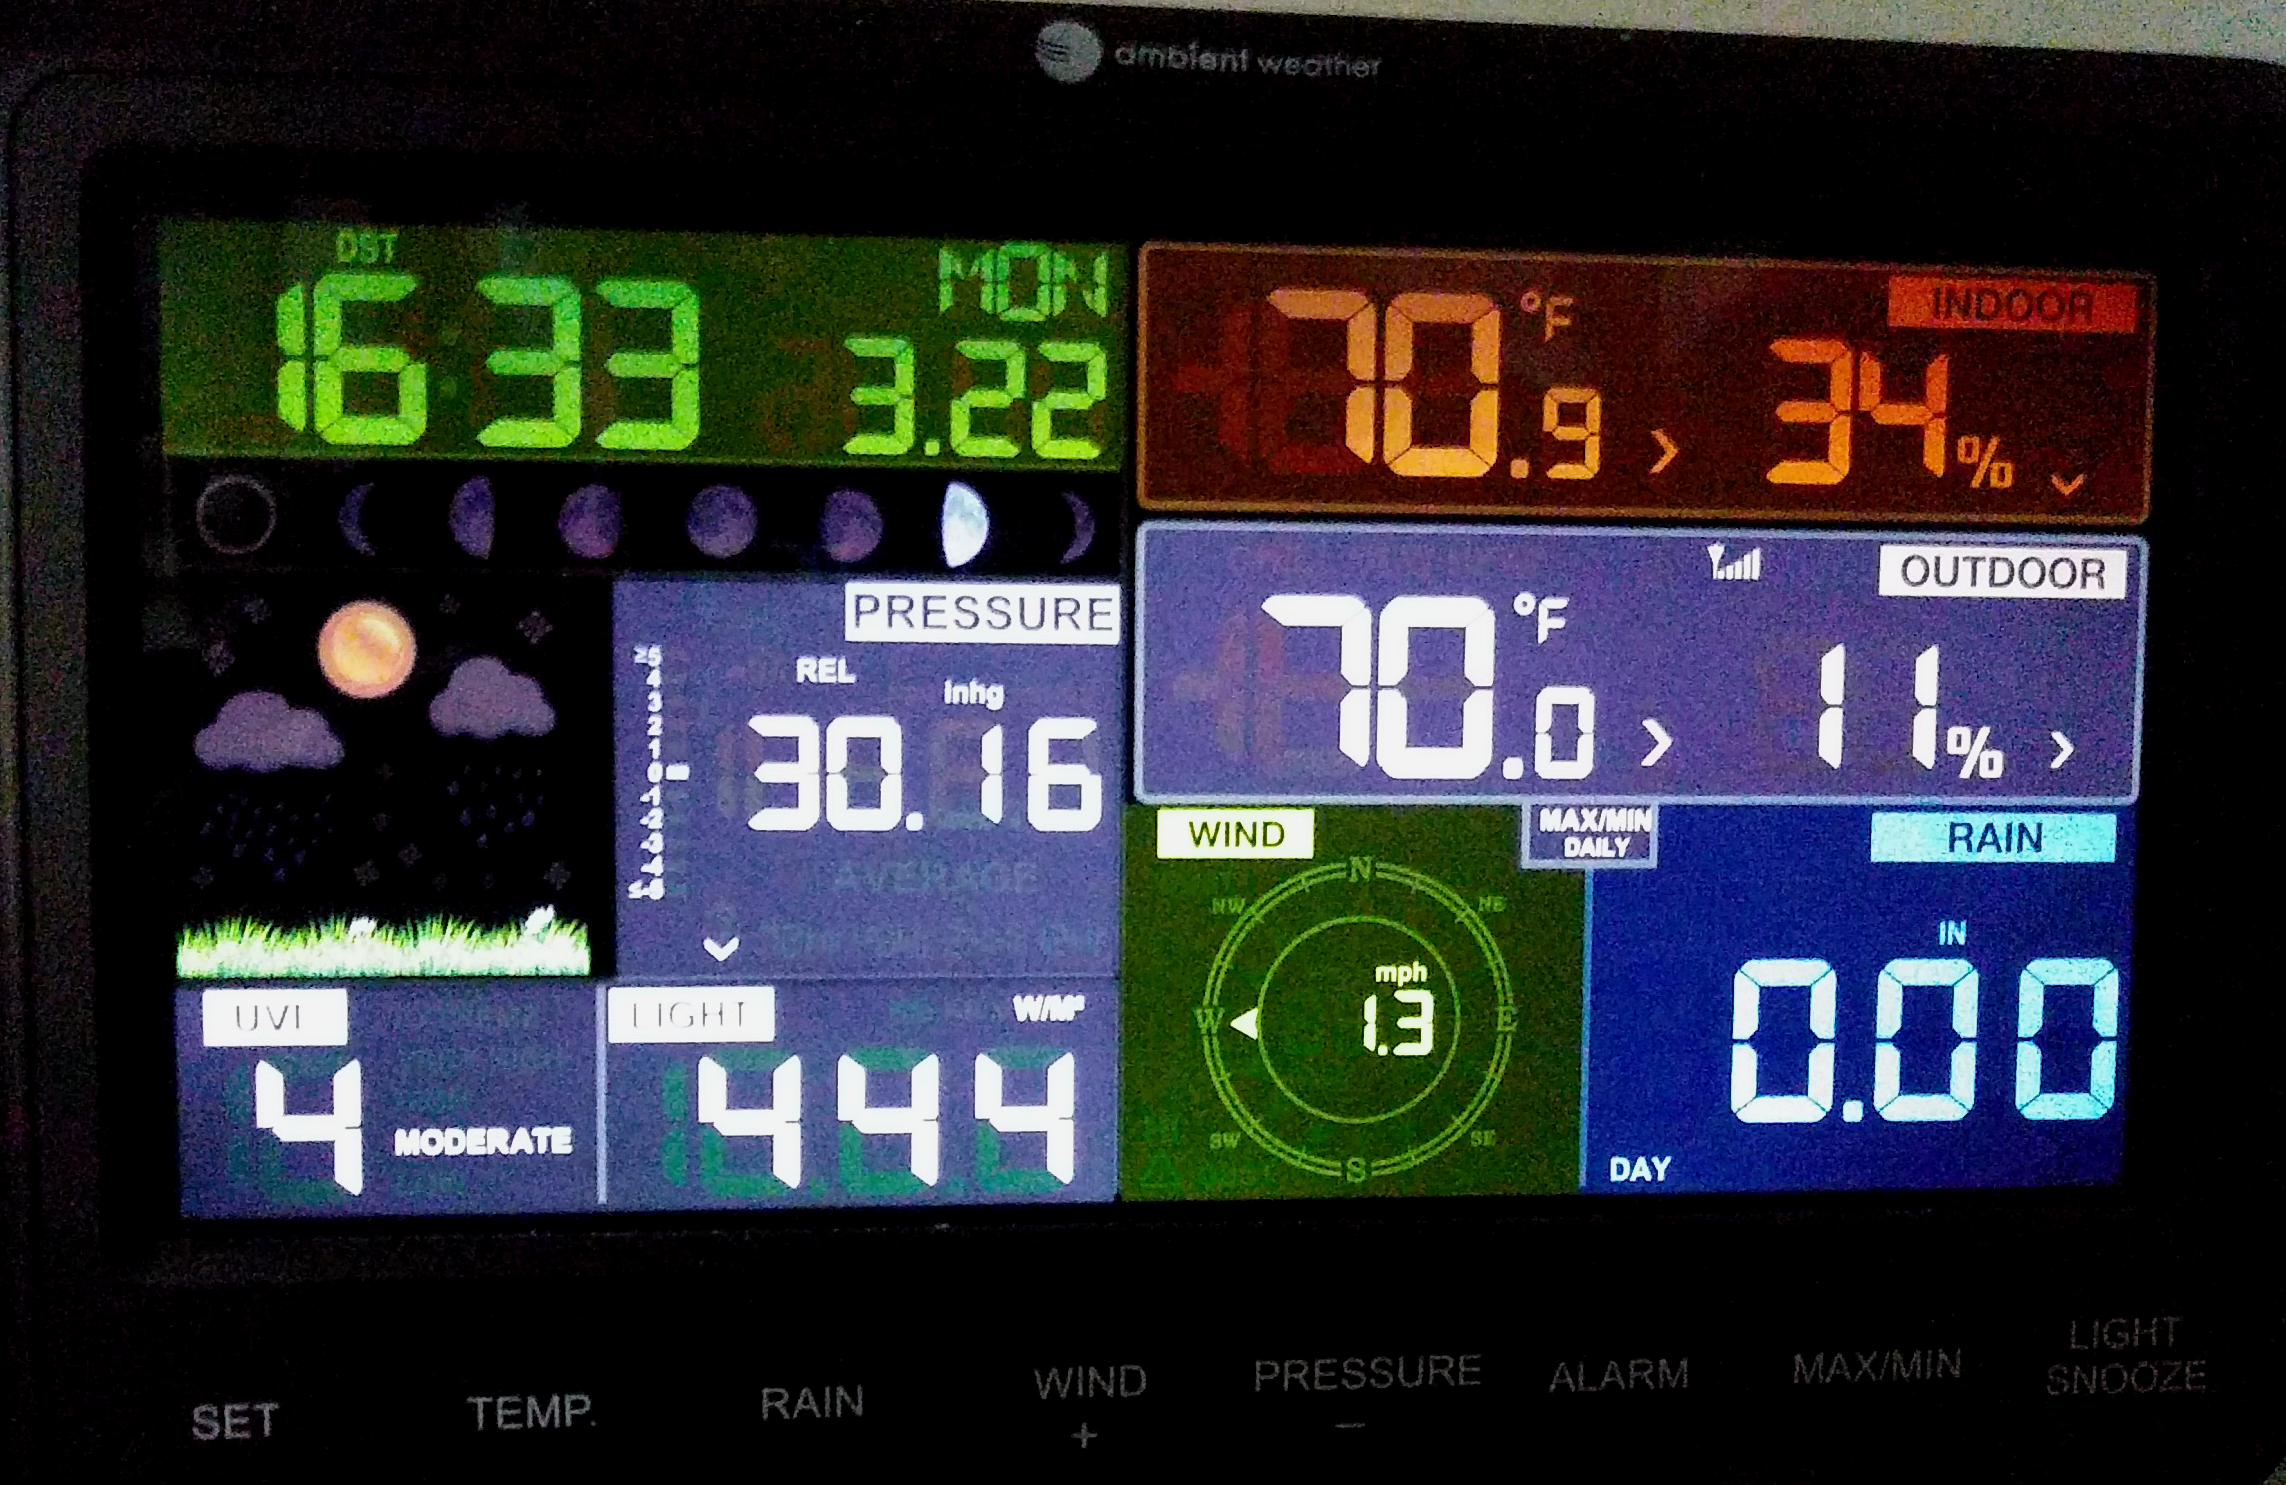
Please forgive the images, the Displays are nicely done, Brightly Colored, and VERY CLEAR. Since the Screen has a reflective cover on it, most of the better images had reflections of my phone, my hand, my head (gasp), so I opted for darker photographs, and therefore they are grainy and less than Sharp. Trust me, the displays are very nice.
The Displays are laid-out differently. But everything is there. The Forecast Icon (2nd row above Set) on the Bottom Unit flashes and displays precipitation if the Barometric Pressure dropped significantly. On the Top Unit (2nd row above the gap between Pressure and Alarm), it monitors for the same, but just shows the Precipitation without flashing the Forecast Icon. The Instructions say that such changes indicate that the weather is 24 to 48 Hours away, not immediate. They also say to allow one month for the unit to learn the pressure characteristic of the area.
The Wind Speed and Direction on the Top Unit (marked in both cases) shows the Wind Direction as to Flowing from the Broader Side of the Arrow towards the Narrower Side (Wind Shown FROM Northwest). The Bottom Unit points to where the Wind is coming from, it’s less intuitive, but still workable, in this case, the Wind Shown from the West.
A Christmas Present from my wife to me, this has gotten much use. It’s educational, informative, and to me worth owning one. I’m going to have a post installed to give it a better area for rain and wind speed and direction.
This is the Mount that I bought, and it has proven to be a good match for the Outdoor Weather Unit.
